Week 6
Quantitative Sociology
THE BROAD VIEW
SOCI 316
First impressions often change as we gather more information—i.e., data points—allowing us to fine-tune our inferences about how person x might behave in different situations.
Just as in statistical inference, more data helps us move from crude hypotheses to well-defined expectations about how x might behave within specific situational constraints.
Here’s a general rule-of-thumb—
In quantitative sociological research, we often strive to generalize our findings—not just to draw inferences about person x, but to make tenable claims about U, a broader target population. To wit, we want our insights to tell us something meaningful about a large set of units—people, countries, firms, documents, etc.
Social scientists are often interested in drawing causal inferences.
X \to Y
About what, exactly? There are a dizzying array of examples. Here are three questions that (implicity or explicitly) invite causal claims—
Do smaller class sizes improve pedagogical outcomes?
Will investments in family planning programs improve economic and health outcomes for women in low-income settings?
Did the cultural grievances of the “middle class” trigger the rise of fascist politics in interwar Europe?
We can, of course, deploy quantitative tools (e.g., estimators, weighting, causal diagrams, experiments) to “resolve” these questions—or at least adduce evidence grounded in statistical reasoning.
For simplicity, let’s assume that our (three) outcomes of substantive interest are approximately linear. Can we estimate a linear regression model to “resolve” our three research questions?
y = \beta_0 + \beta_1 x + \epsilon
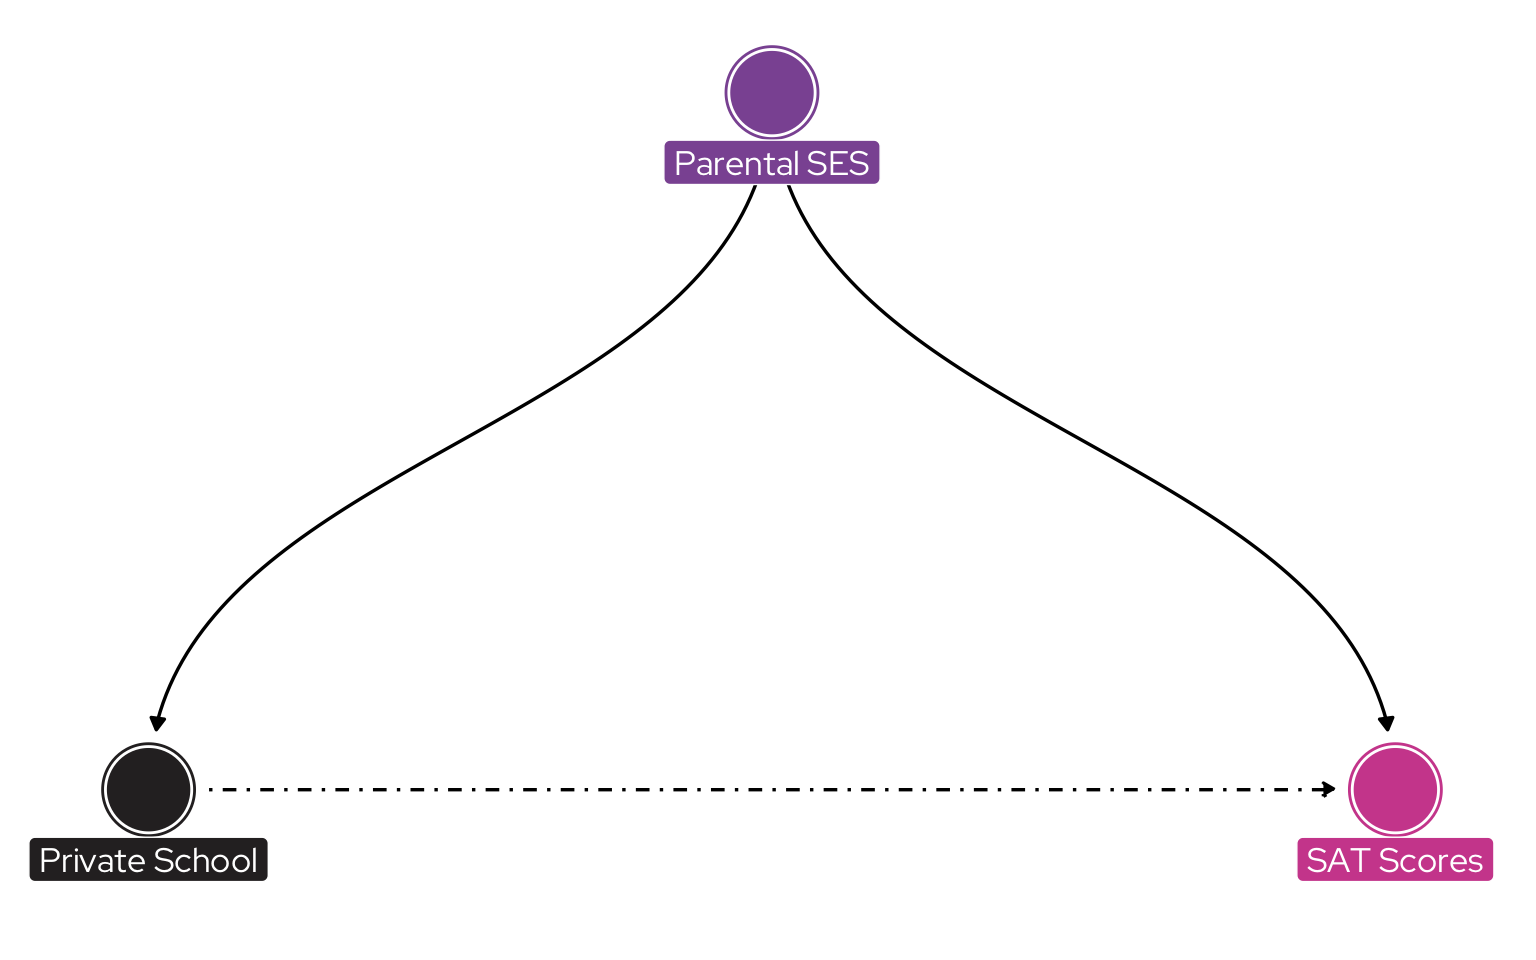
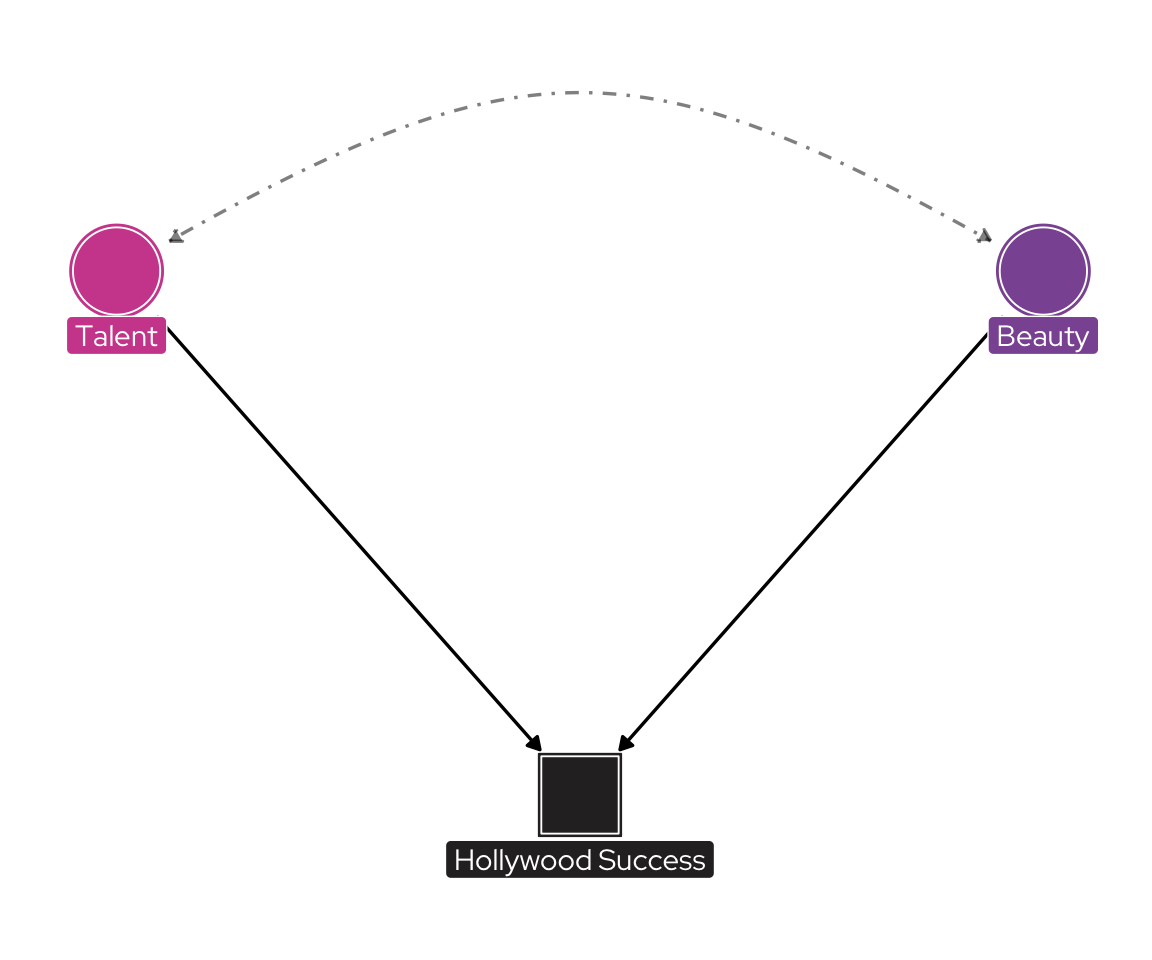
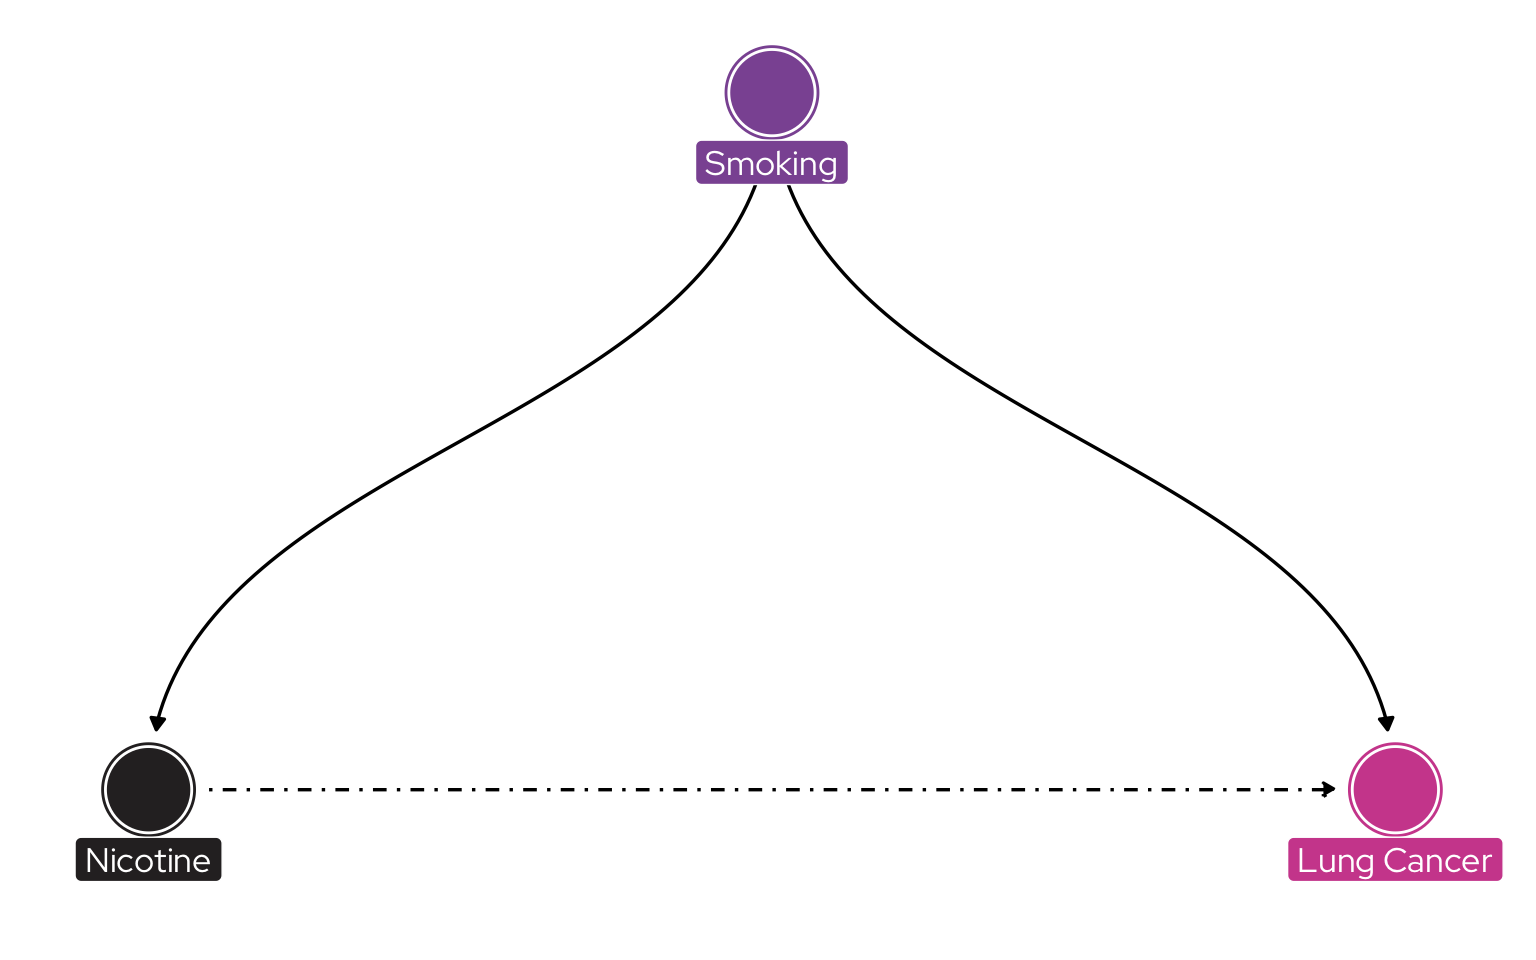
Adaptation of Figure 4
from Elwert and Winship (2014).
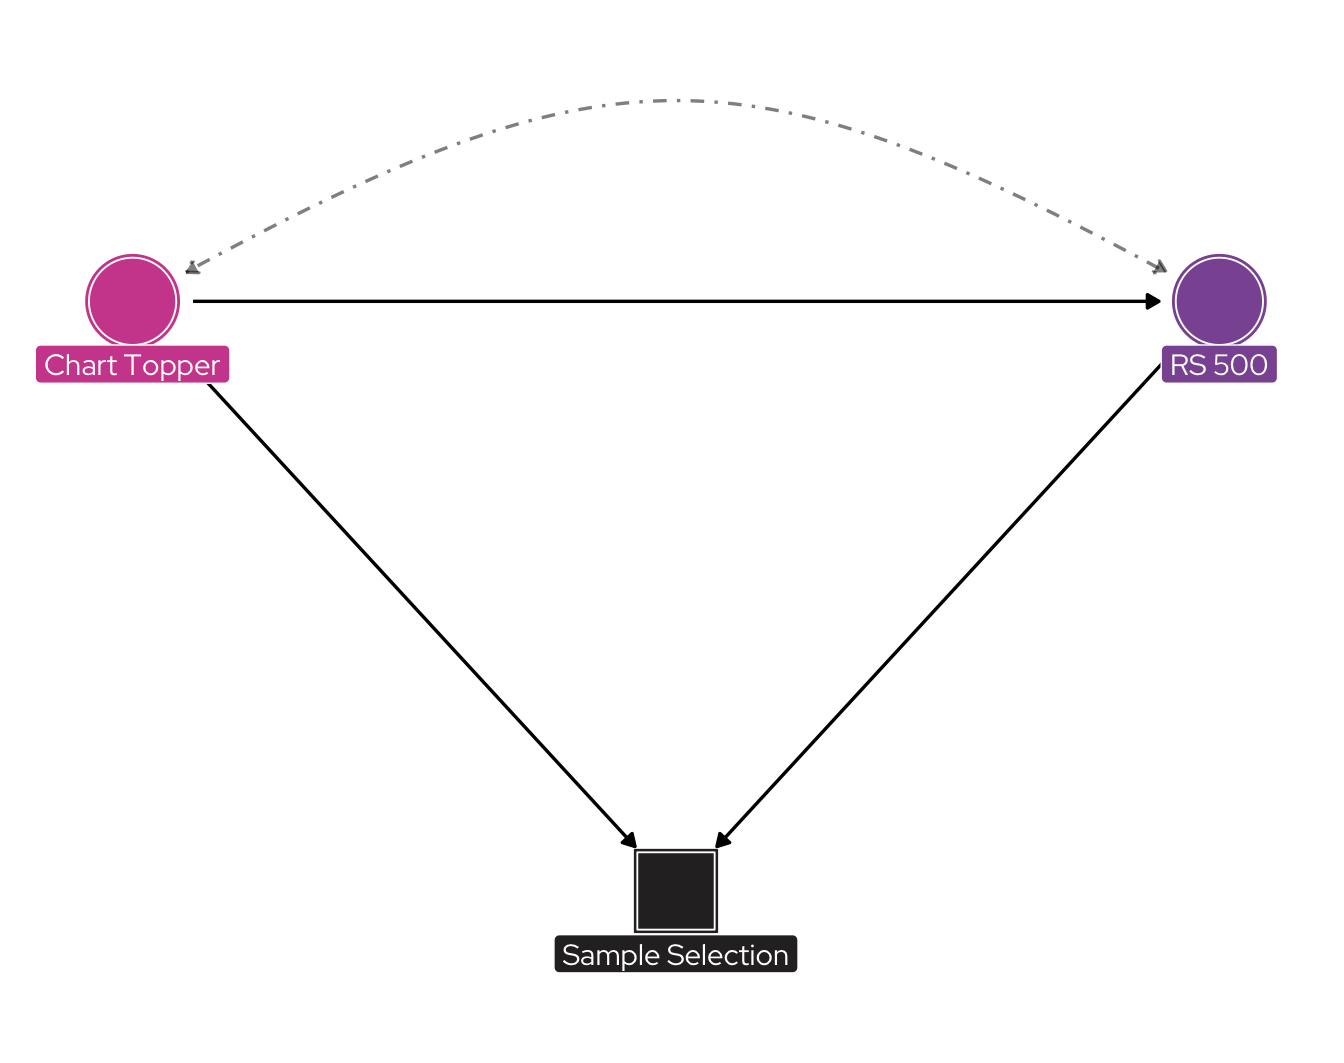
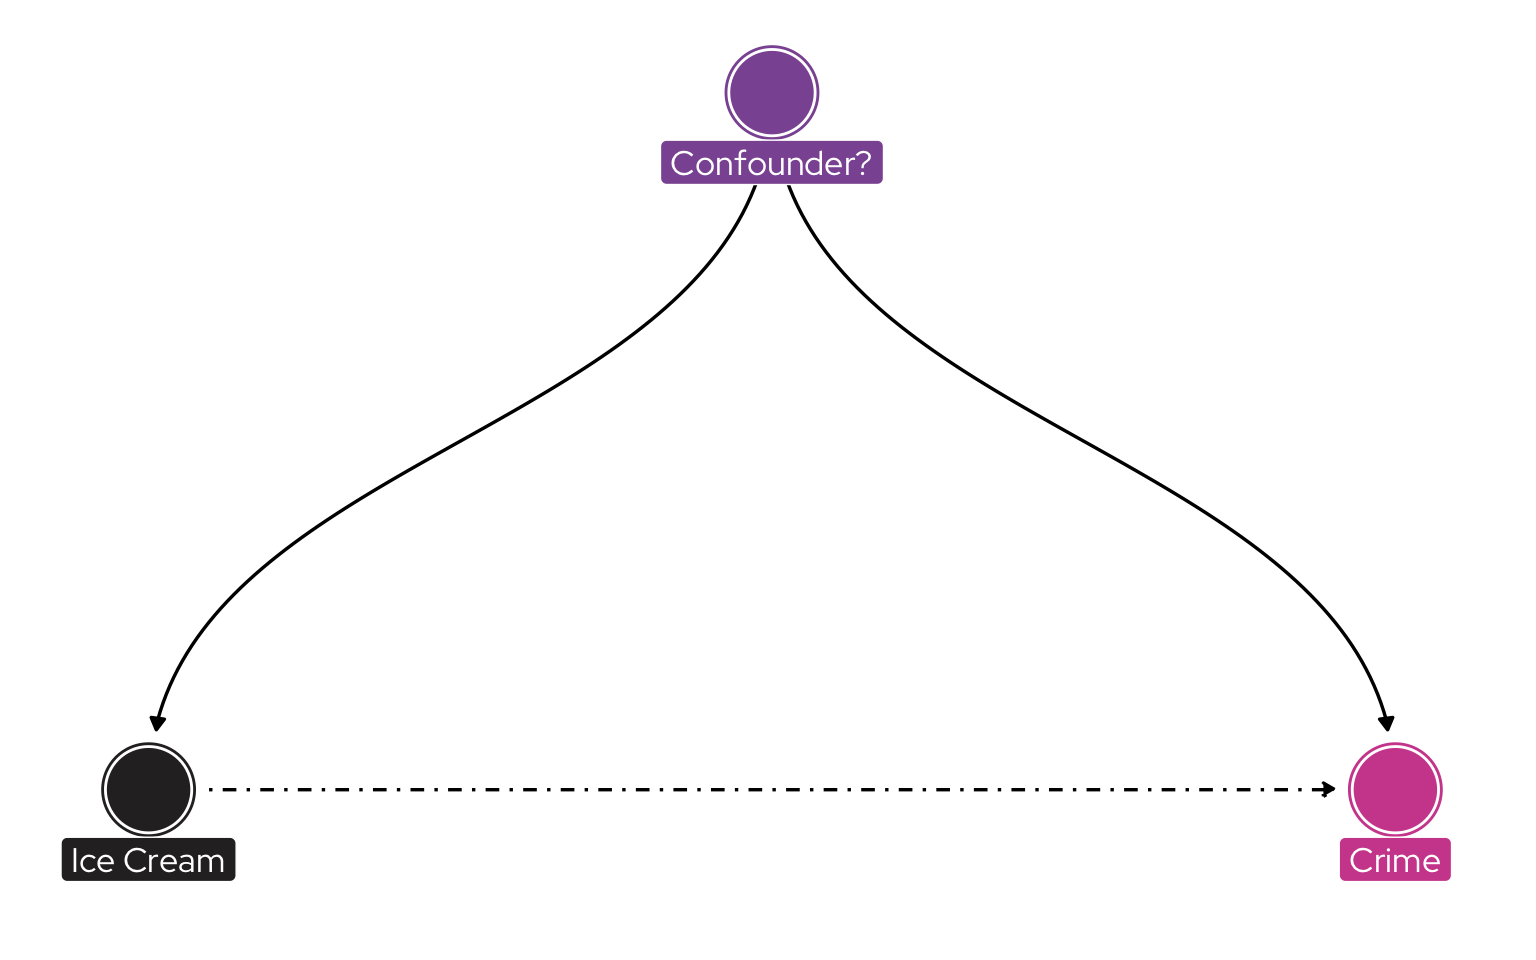
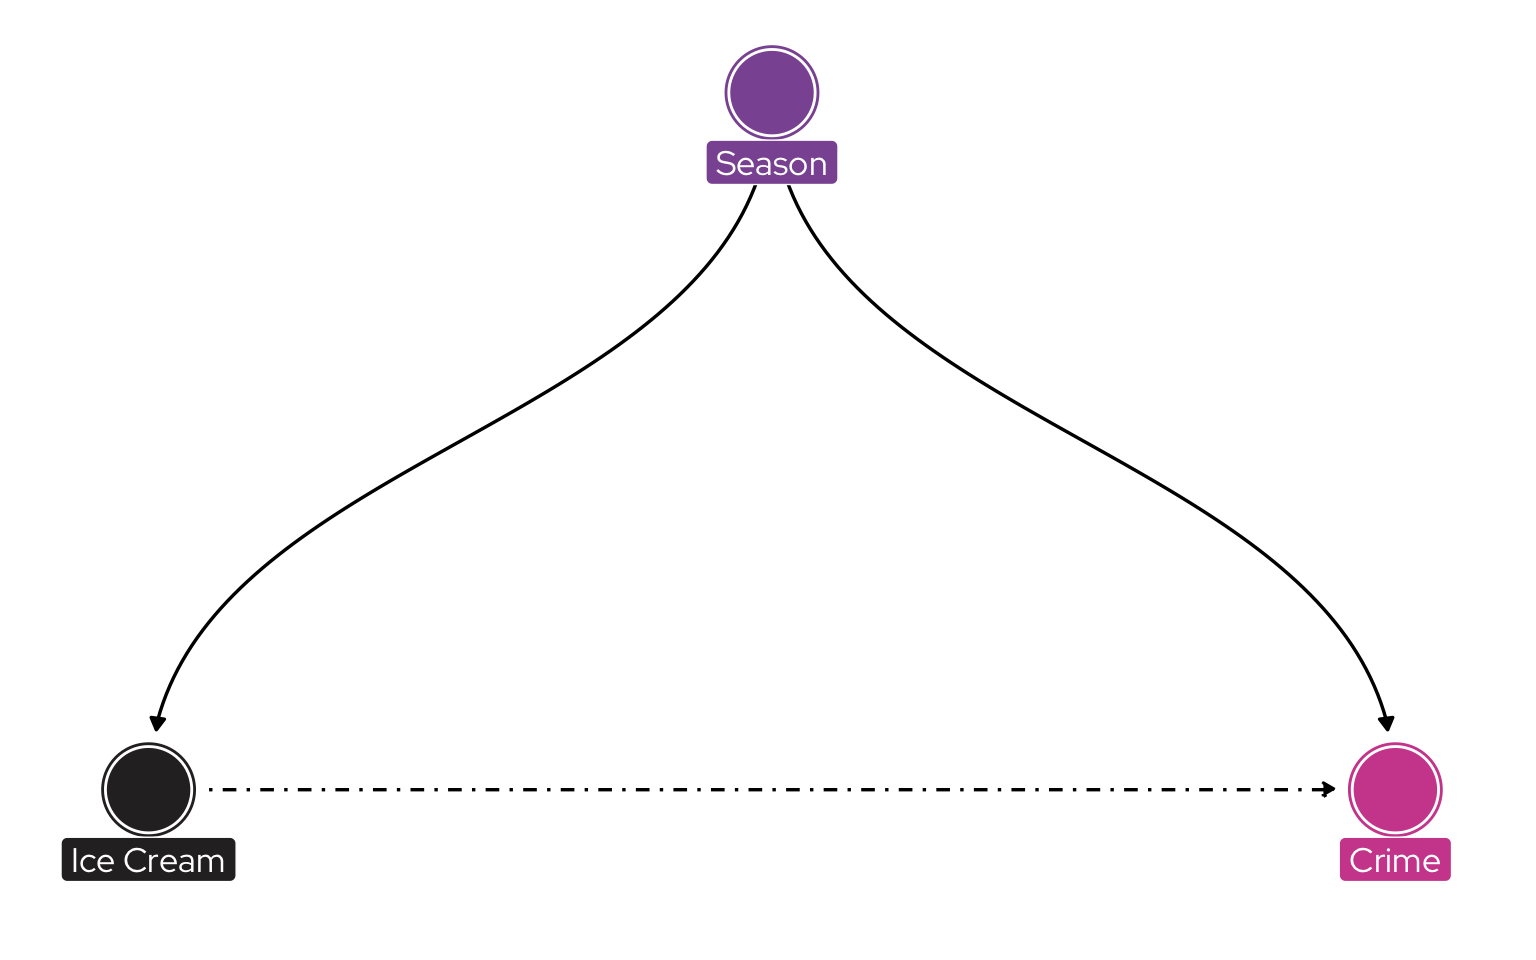
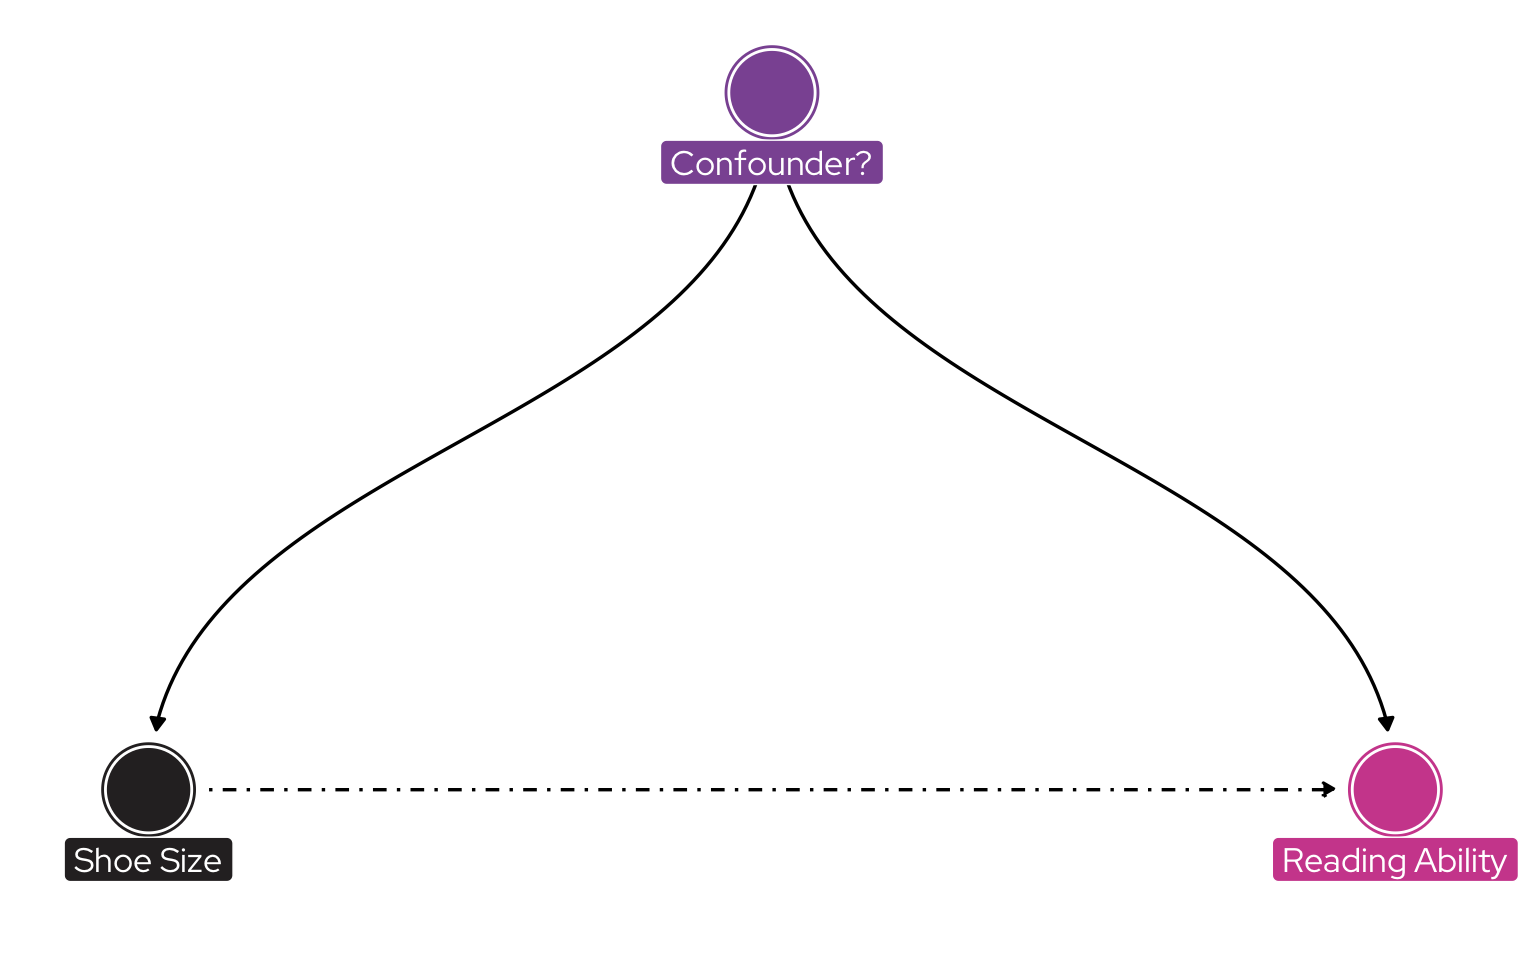
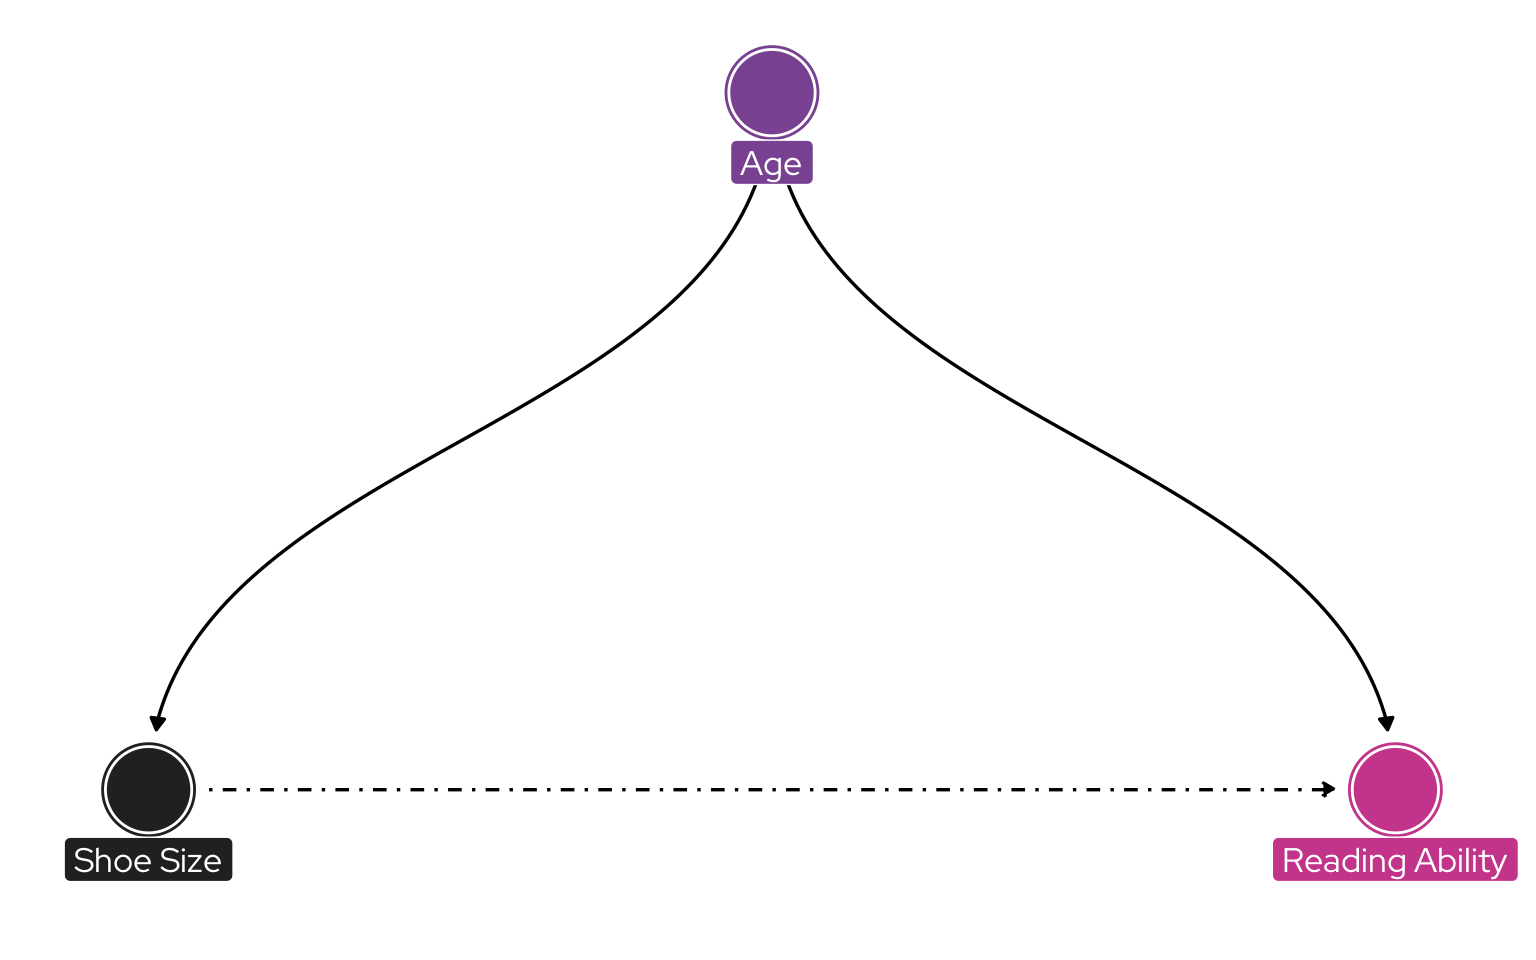
Adaptation of Figure 7
from Elwert and Winship (2014).
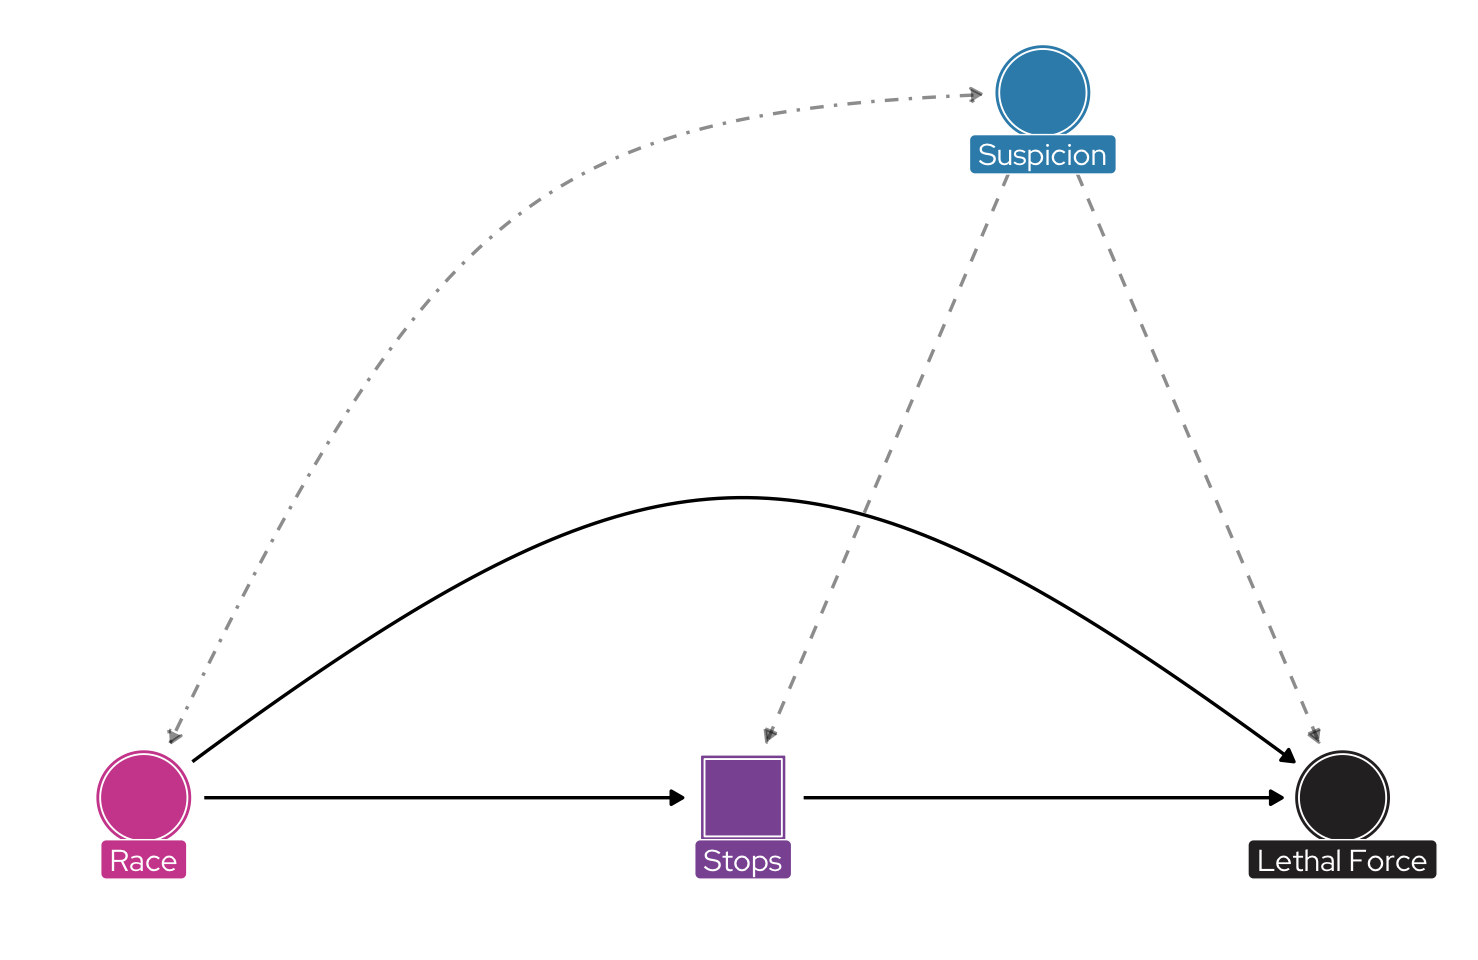
Adaptation of Figure 1
from Knox, Lowe and Mummolo (2020).
For the rest of today’s session, strike up a conversation with someone you don’t know particularly well.
During your discussion, please respond to the following questions—
If your project will feature a quantitative dimension, how are you planning to measure your key constructs and test your guiding assumptions about x, your phenomenon of interest?
If your project will not feature a quantitative dimension, how could you integrate quantitative data analysis into your work?
What are the causal assumptions animating your research?
How can we transcend the GLR Abbott (1988) was decrying?
Networks are, perhaps, the paradigmatic example.
Network-analytic techniques are inherently relational
(see Emirbayer 1997; Mohr 2013).
Are relational approaches to measurement compatible with “variable-centred” techniques and “substantialist” frameworks?
Although this resurgence of interest in cultural phenomena is often associated with the shift towards more humanistic and interpretative methodologies, an increasing number of quantitatively oriented scholars have also begun to turn their attention to the study of cultural meanings. In the process a new body of research has begun to emerge in which social practices, classificatory distinctions, and cultural artifacts of various sorts are being formally analyzed in order to reveal underlying structures of meaning.
(Mohr 1998, 345, EMPHASIS ADDED)
Today, this body of research arguably stands
at the vanguard of the field.
Quantitatively-oriented analyses of “meaning” tend to
follow a basic blueprint—
… (a) basic elements within a cultural system are identified, (b) the pattern of relations between these elements is recorded, (c) a structural organization is identified by applying a pattern-preserving set of reductive principles to the system of relations, and (d) the resulting structure (which now can be used as a representation for the meaning embedded in the cultural system) is reconnected to the institutional context that is being investigated.
(Mohr 1998, 352, EMPHASIS ADDED)
Having collected information regarding the relations of similarity (or difference) among a set of items within a cultural or institutional system, the next task is to find structure-preserving simplifications that may allow the complexity of the system to be more easily understood. Ideally, one hopes to identify some deeper, simpler, structural logic—that is, a principle or set of principles that account for the arrangement of parts within the cultural system … The relations between cultural items are the key to such an investigation. The analytical task is to discover how these relations are related to one another. Structuralist methods are geared toward the identification of transformations that allow the relations among the relations to be reduced to more easily understandable and or visible patterns.
(Mohr 1998, 356, EMPHASIS ADDED)
[W]hat if polarization is less like a fence getting taller over time and more like an oil spill that spreads from its source to gradually taint more and more previously “apolitical” attitudes, opinions, and preferences? … [R]ather than heightened alignment across already-politicized opinion dimensions, the crux of contemporary polarization might lie in the increased breadth of opinions and preferences that have come to be associated with political identities and beliefs. This broadening of opinion alignment to encompass areas typically thought of as nonpolitical would not be picked up in studies that only consider polarization along existing lines of political debate.
(DellaPosta 2020, 508–9, EMPHASIS ADDED)
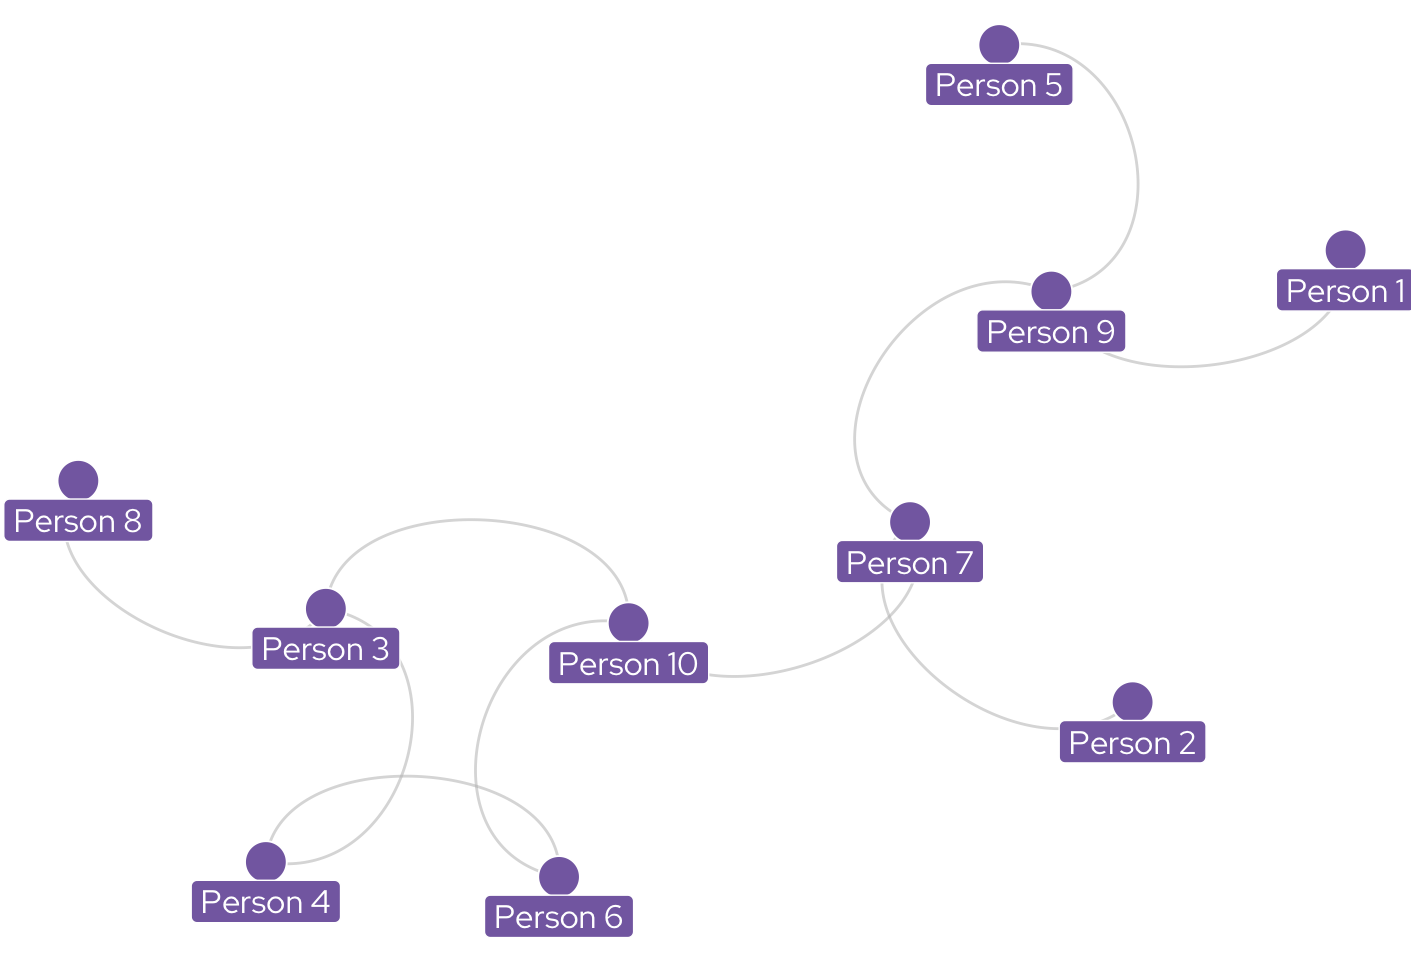
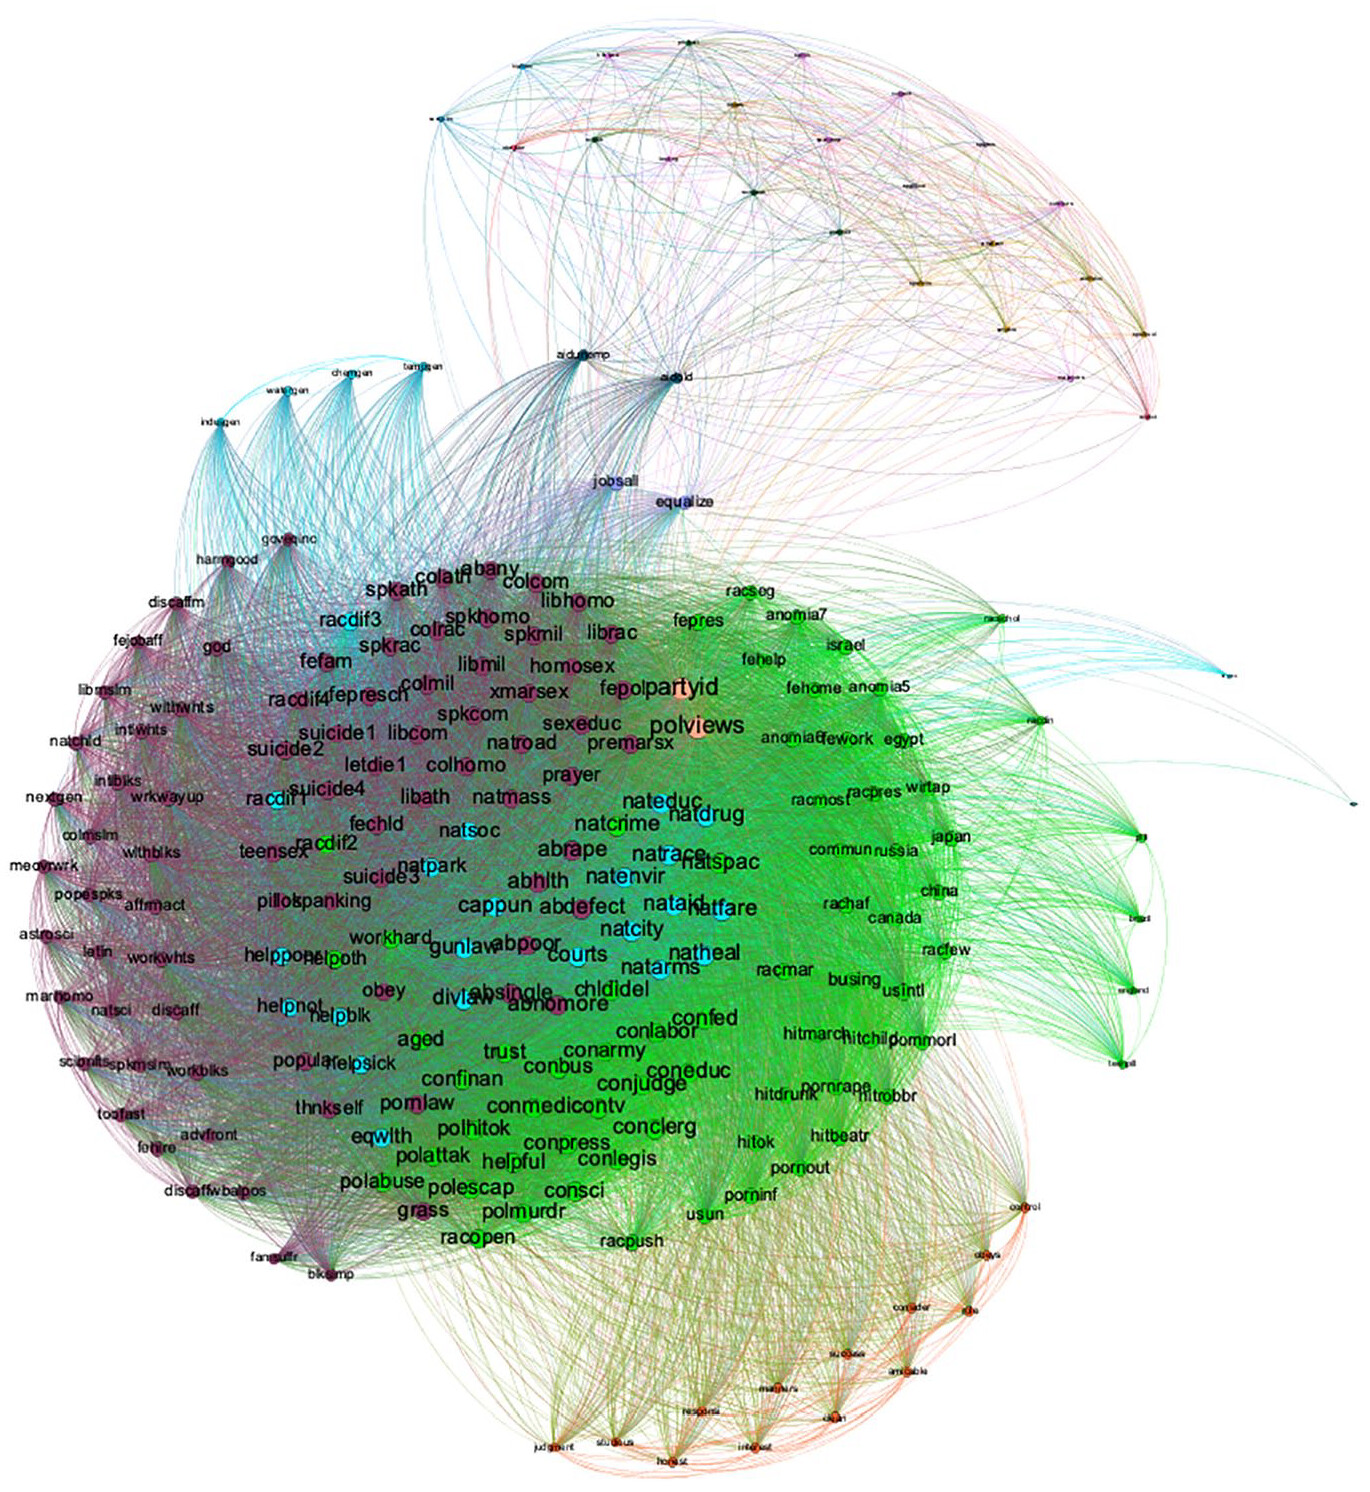
Figure 1
from DellaPosta (2020).
GSS Belief Network — 1972 (DellaPosta 2020)
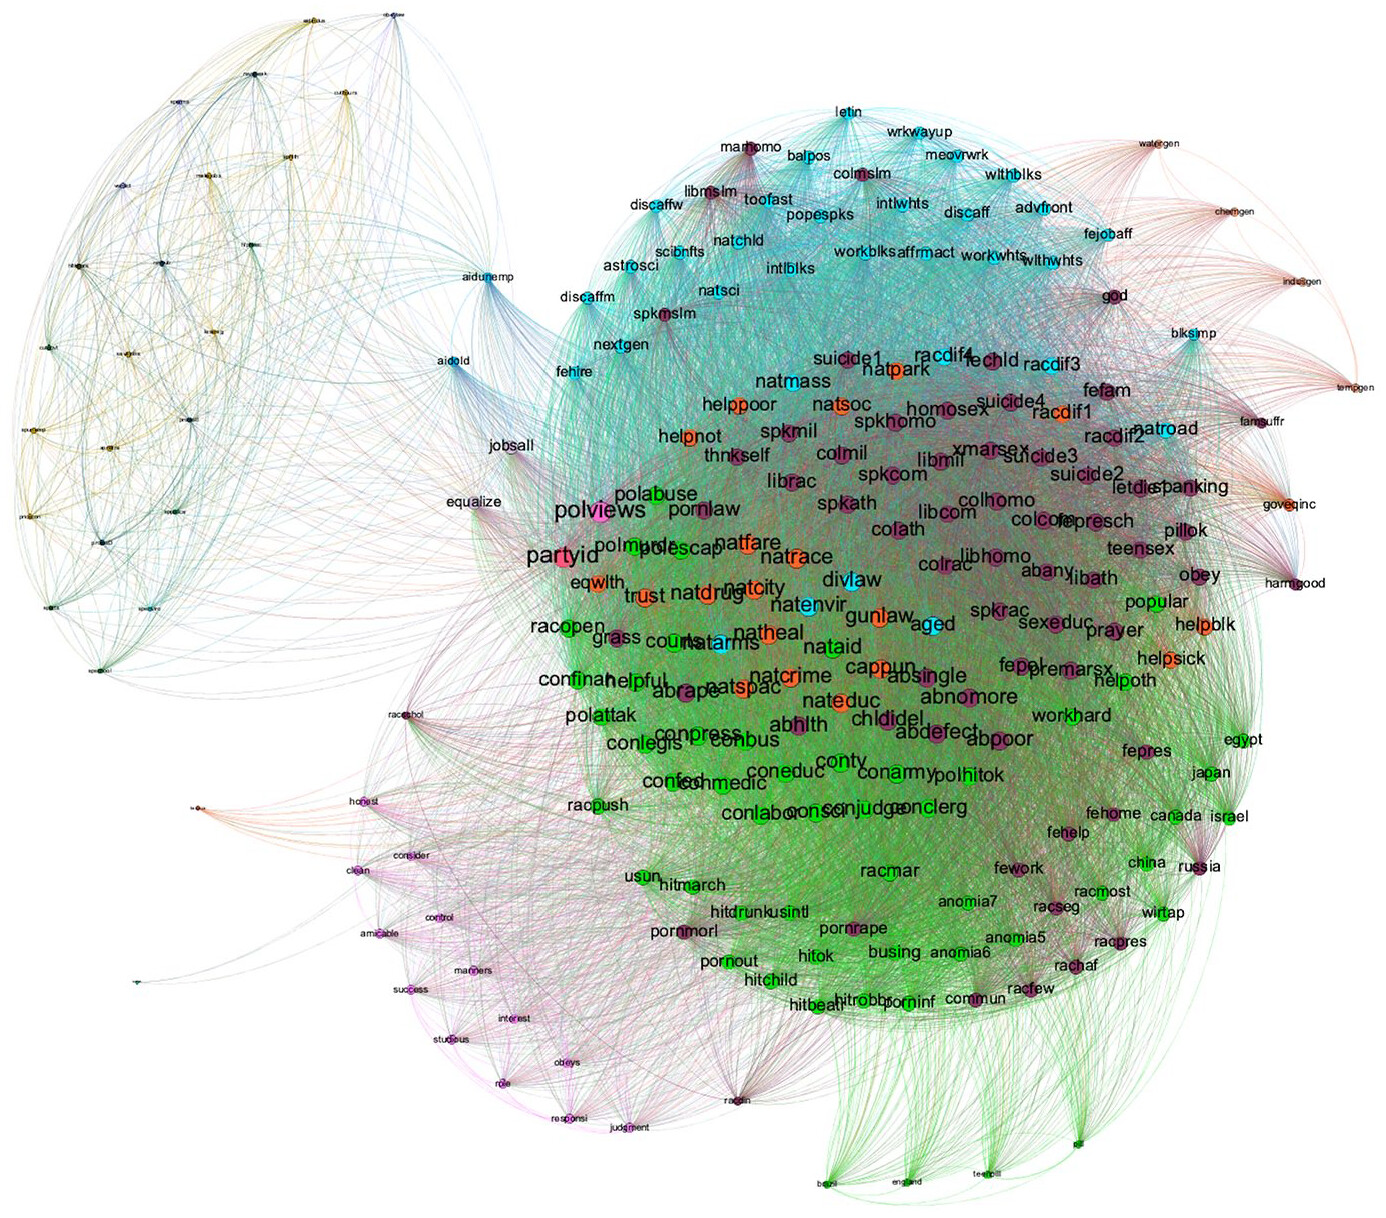
GSS Belief Network — 2016 (DellaPosta 2020)
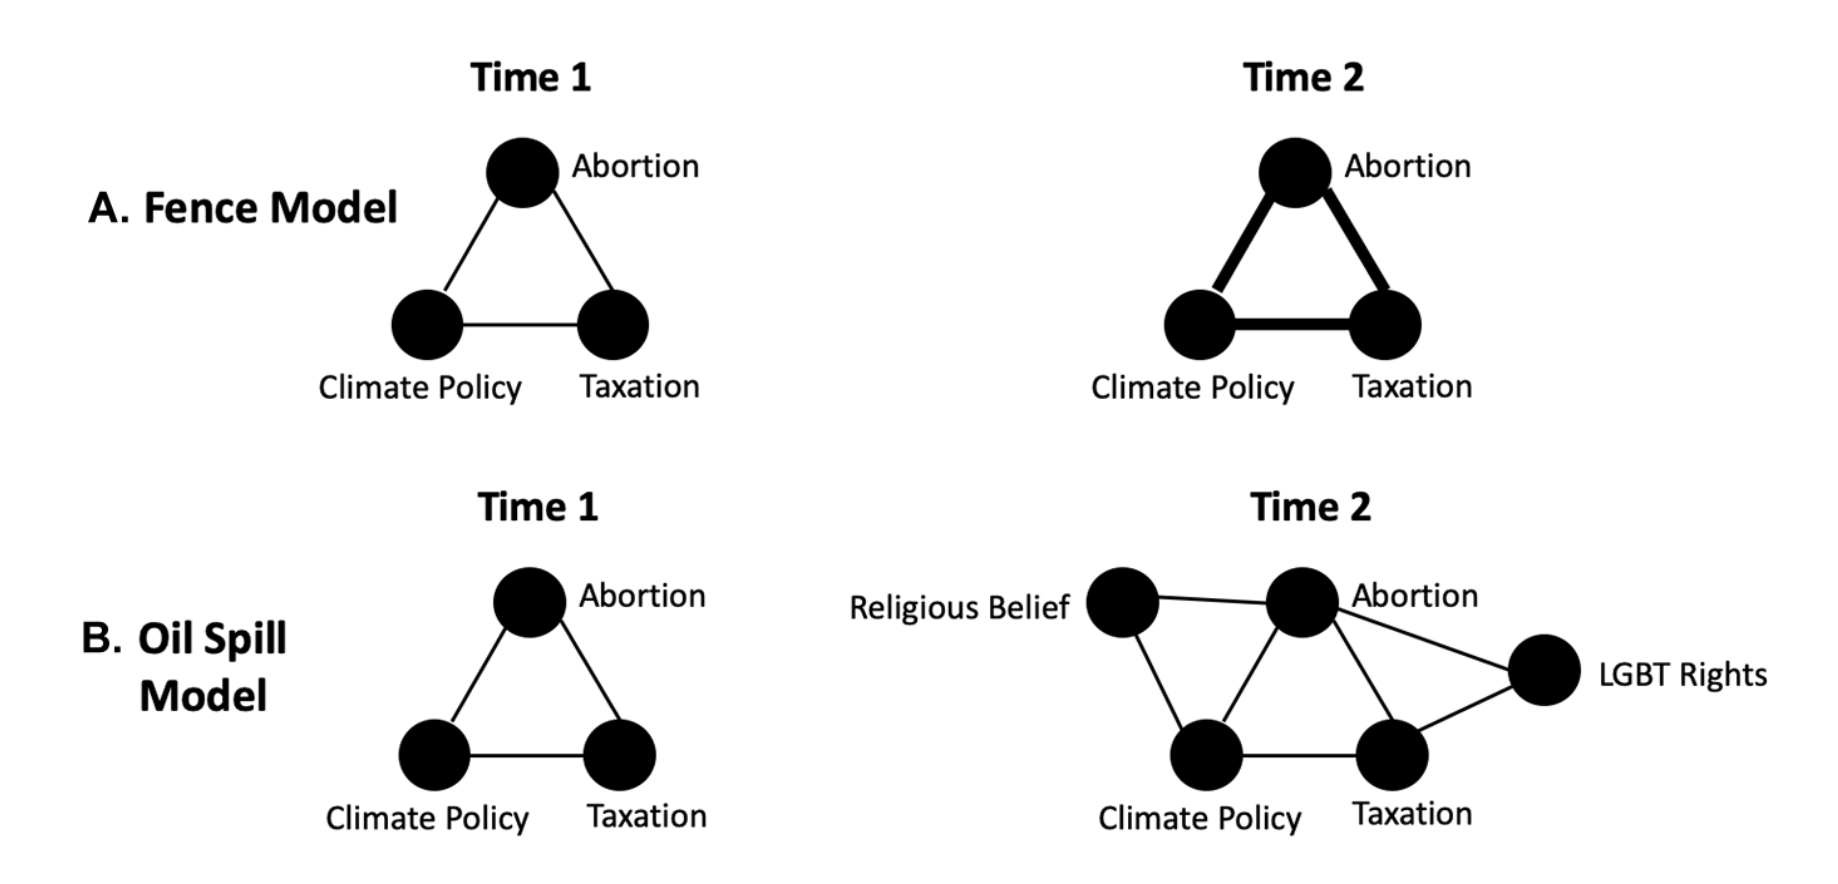
Figures 4
& 5
from DellaPosta (2020).
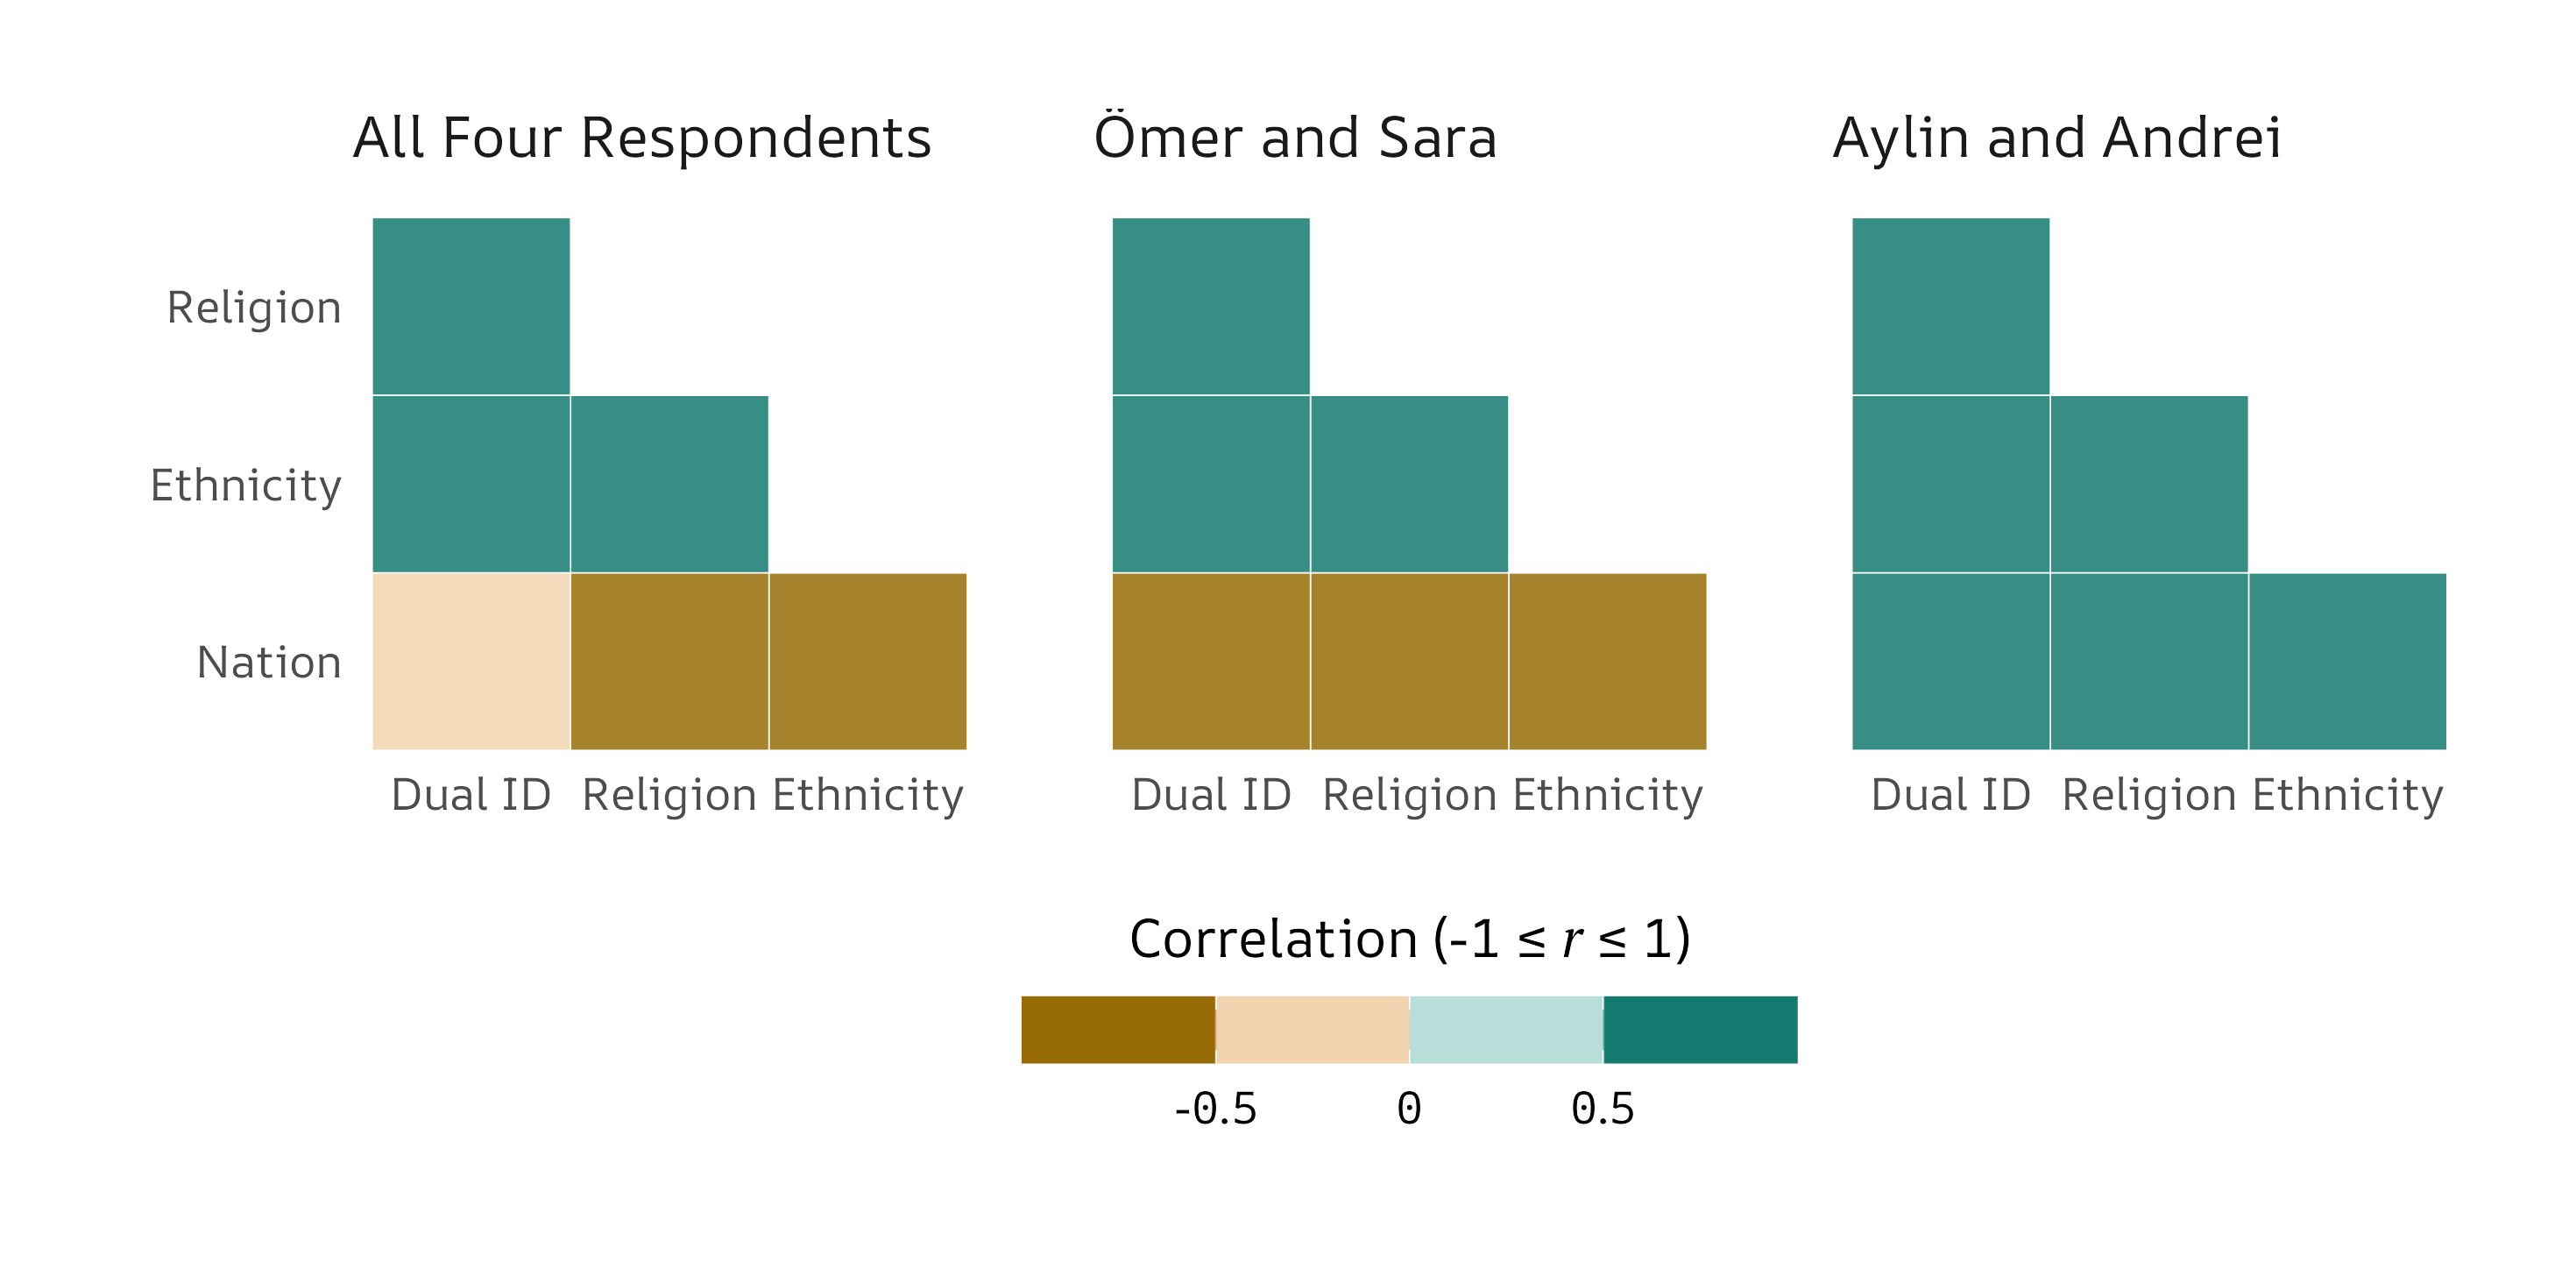
Figure 1
from Karim (2024).
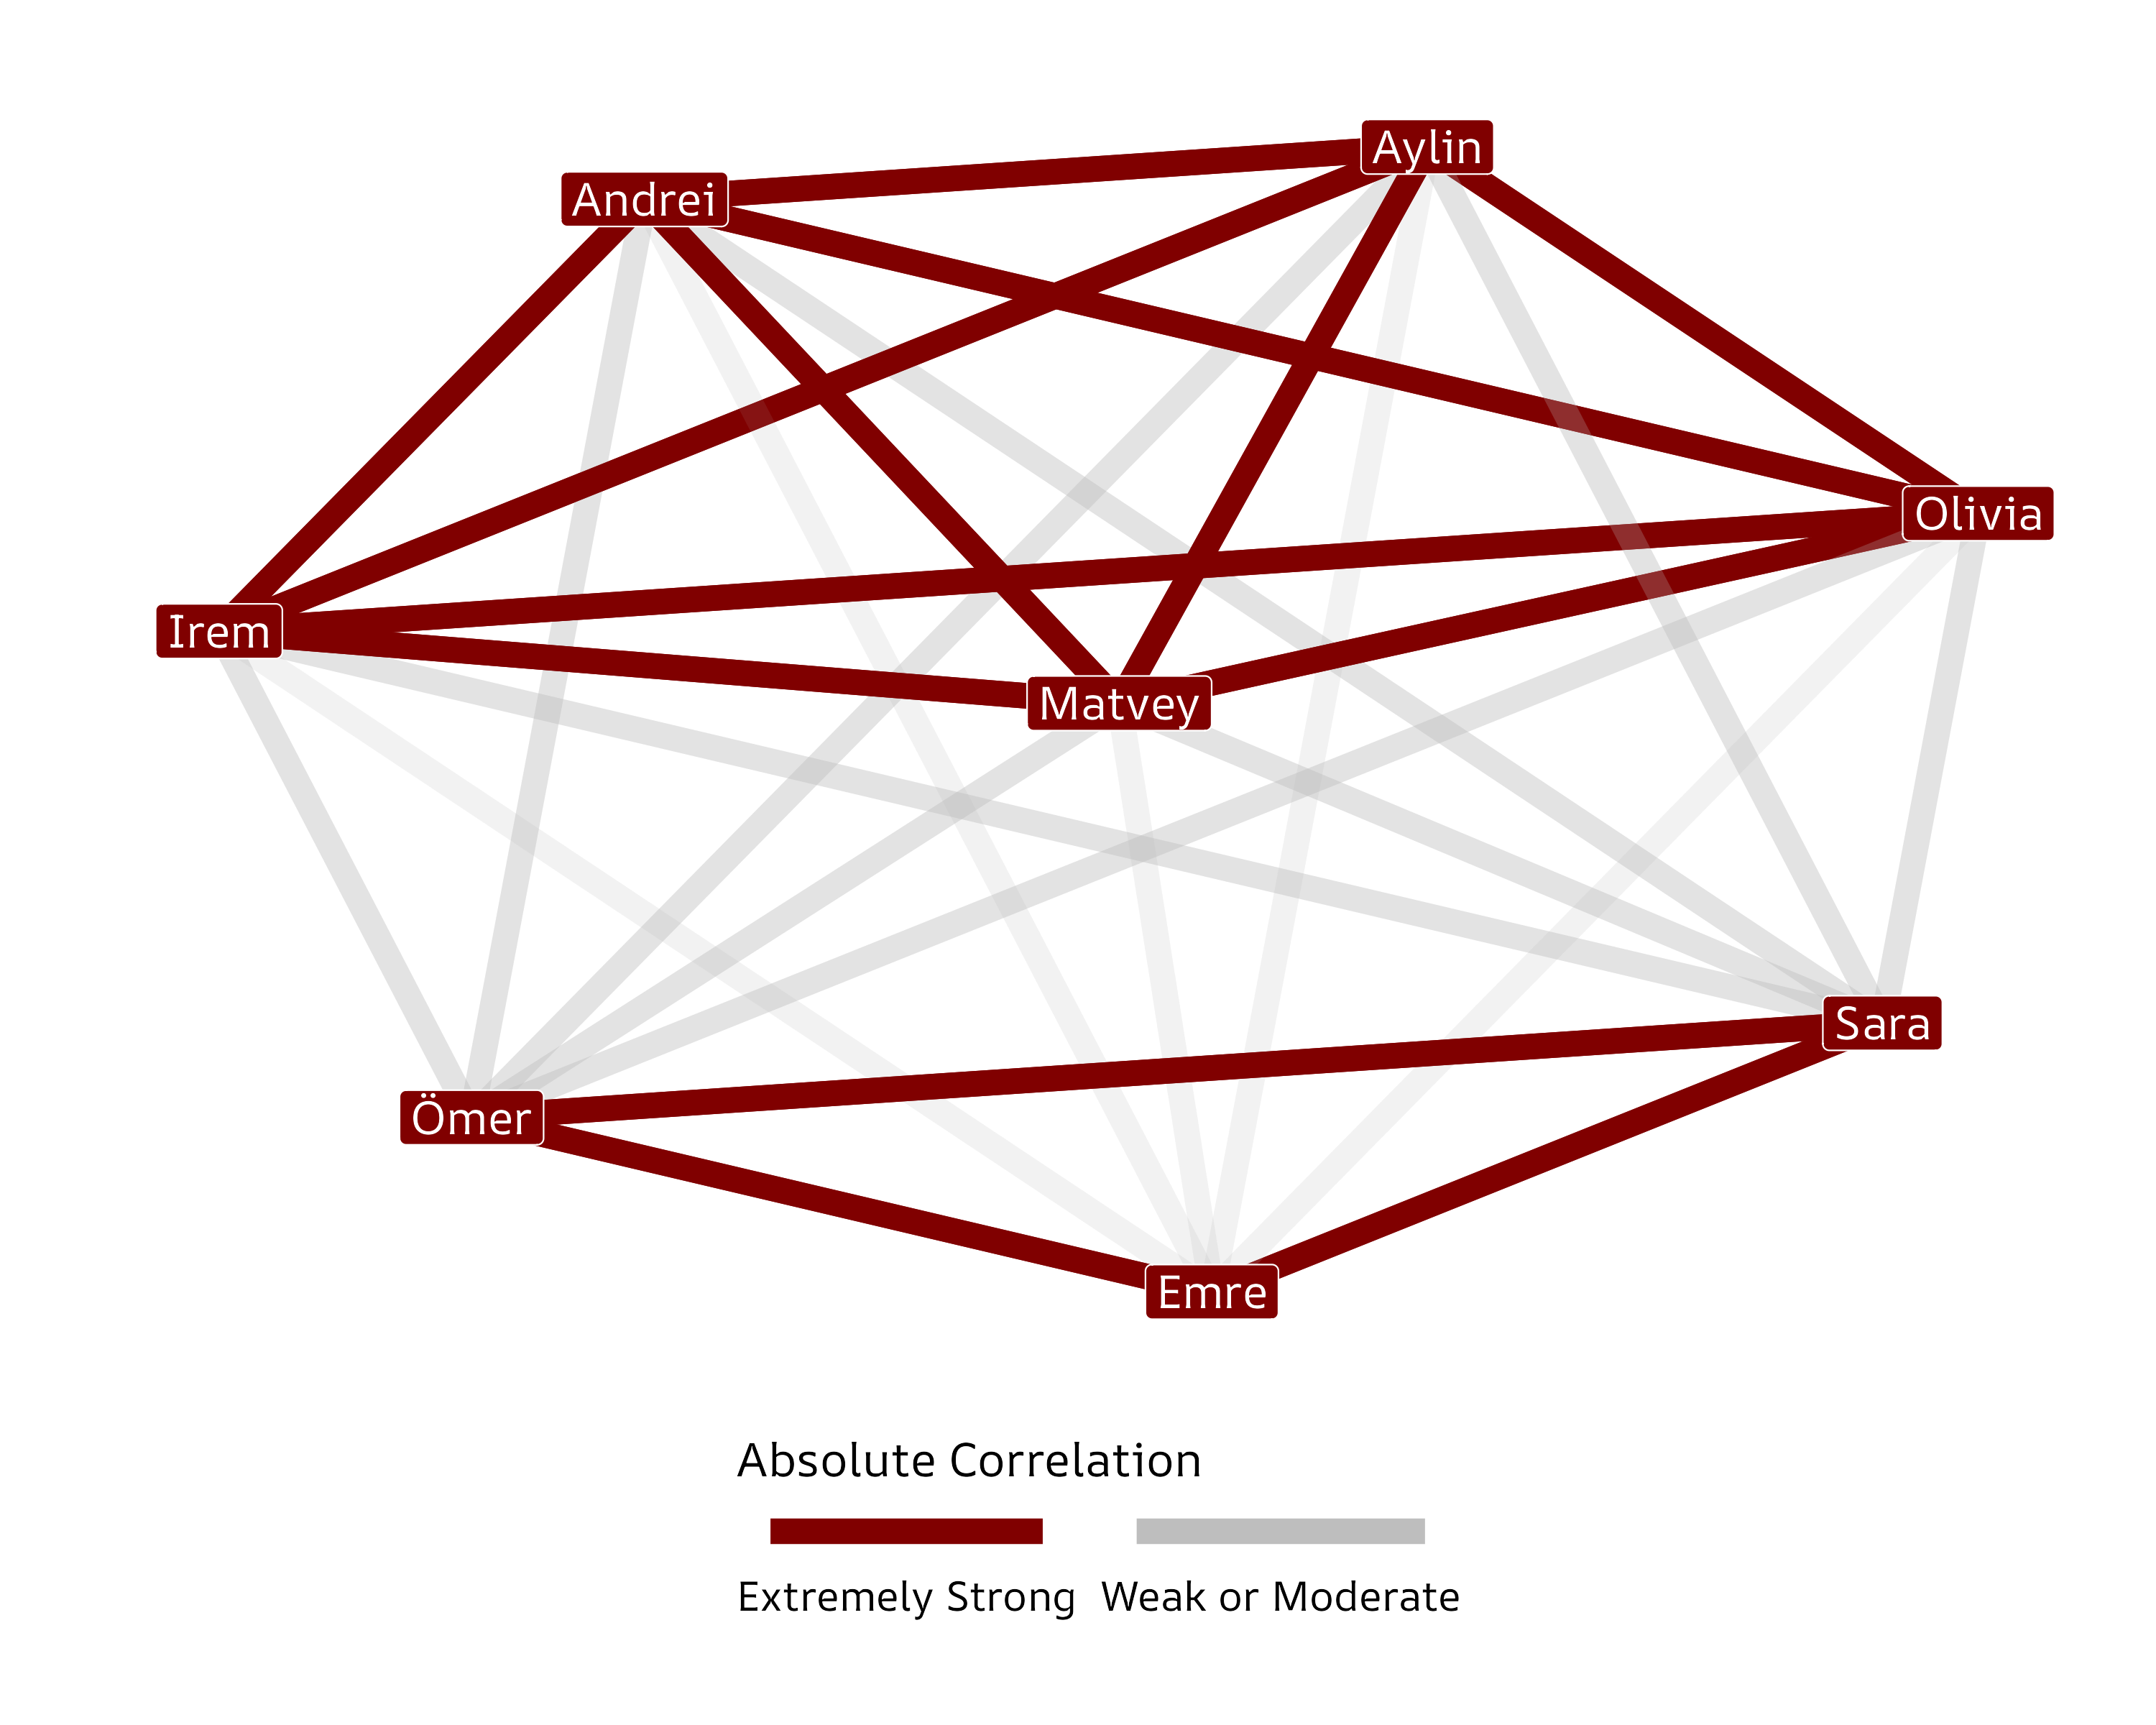
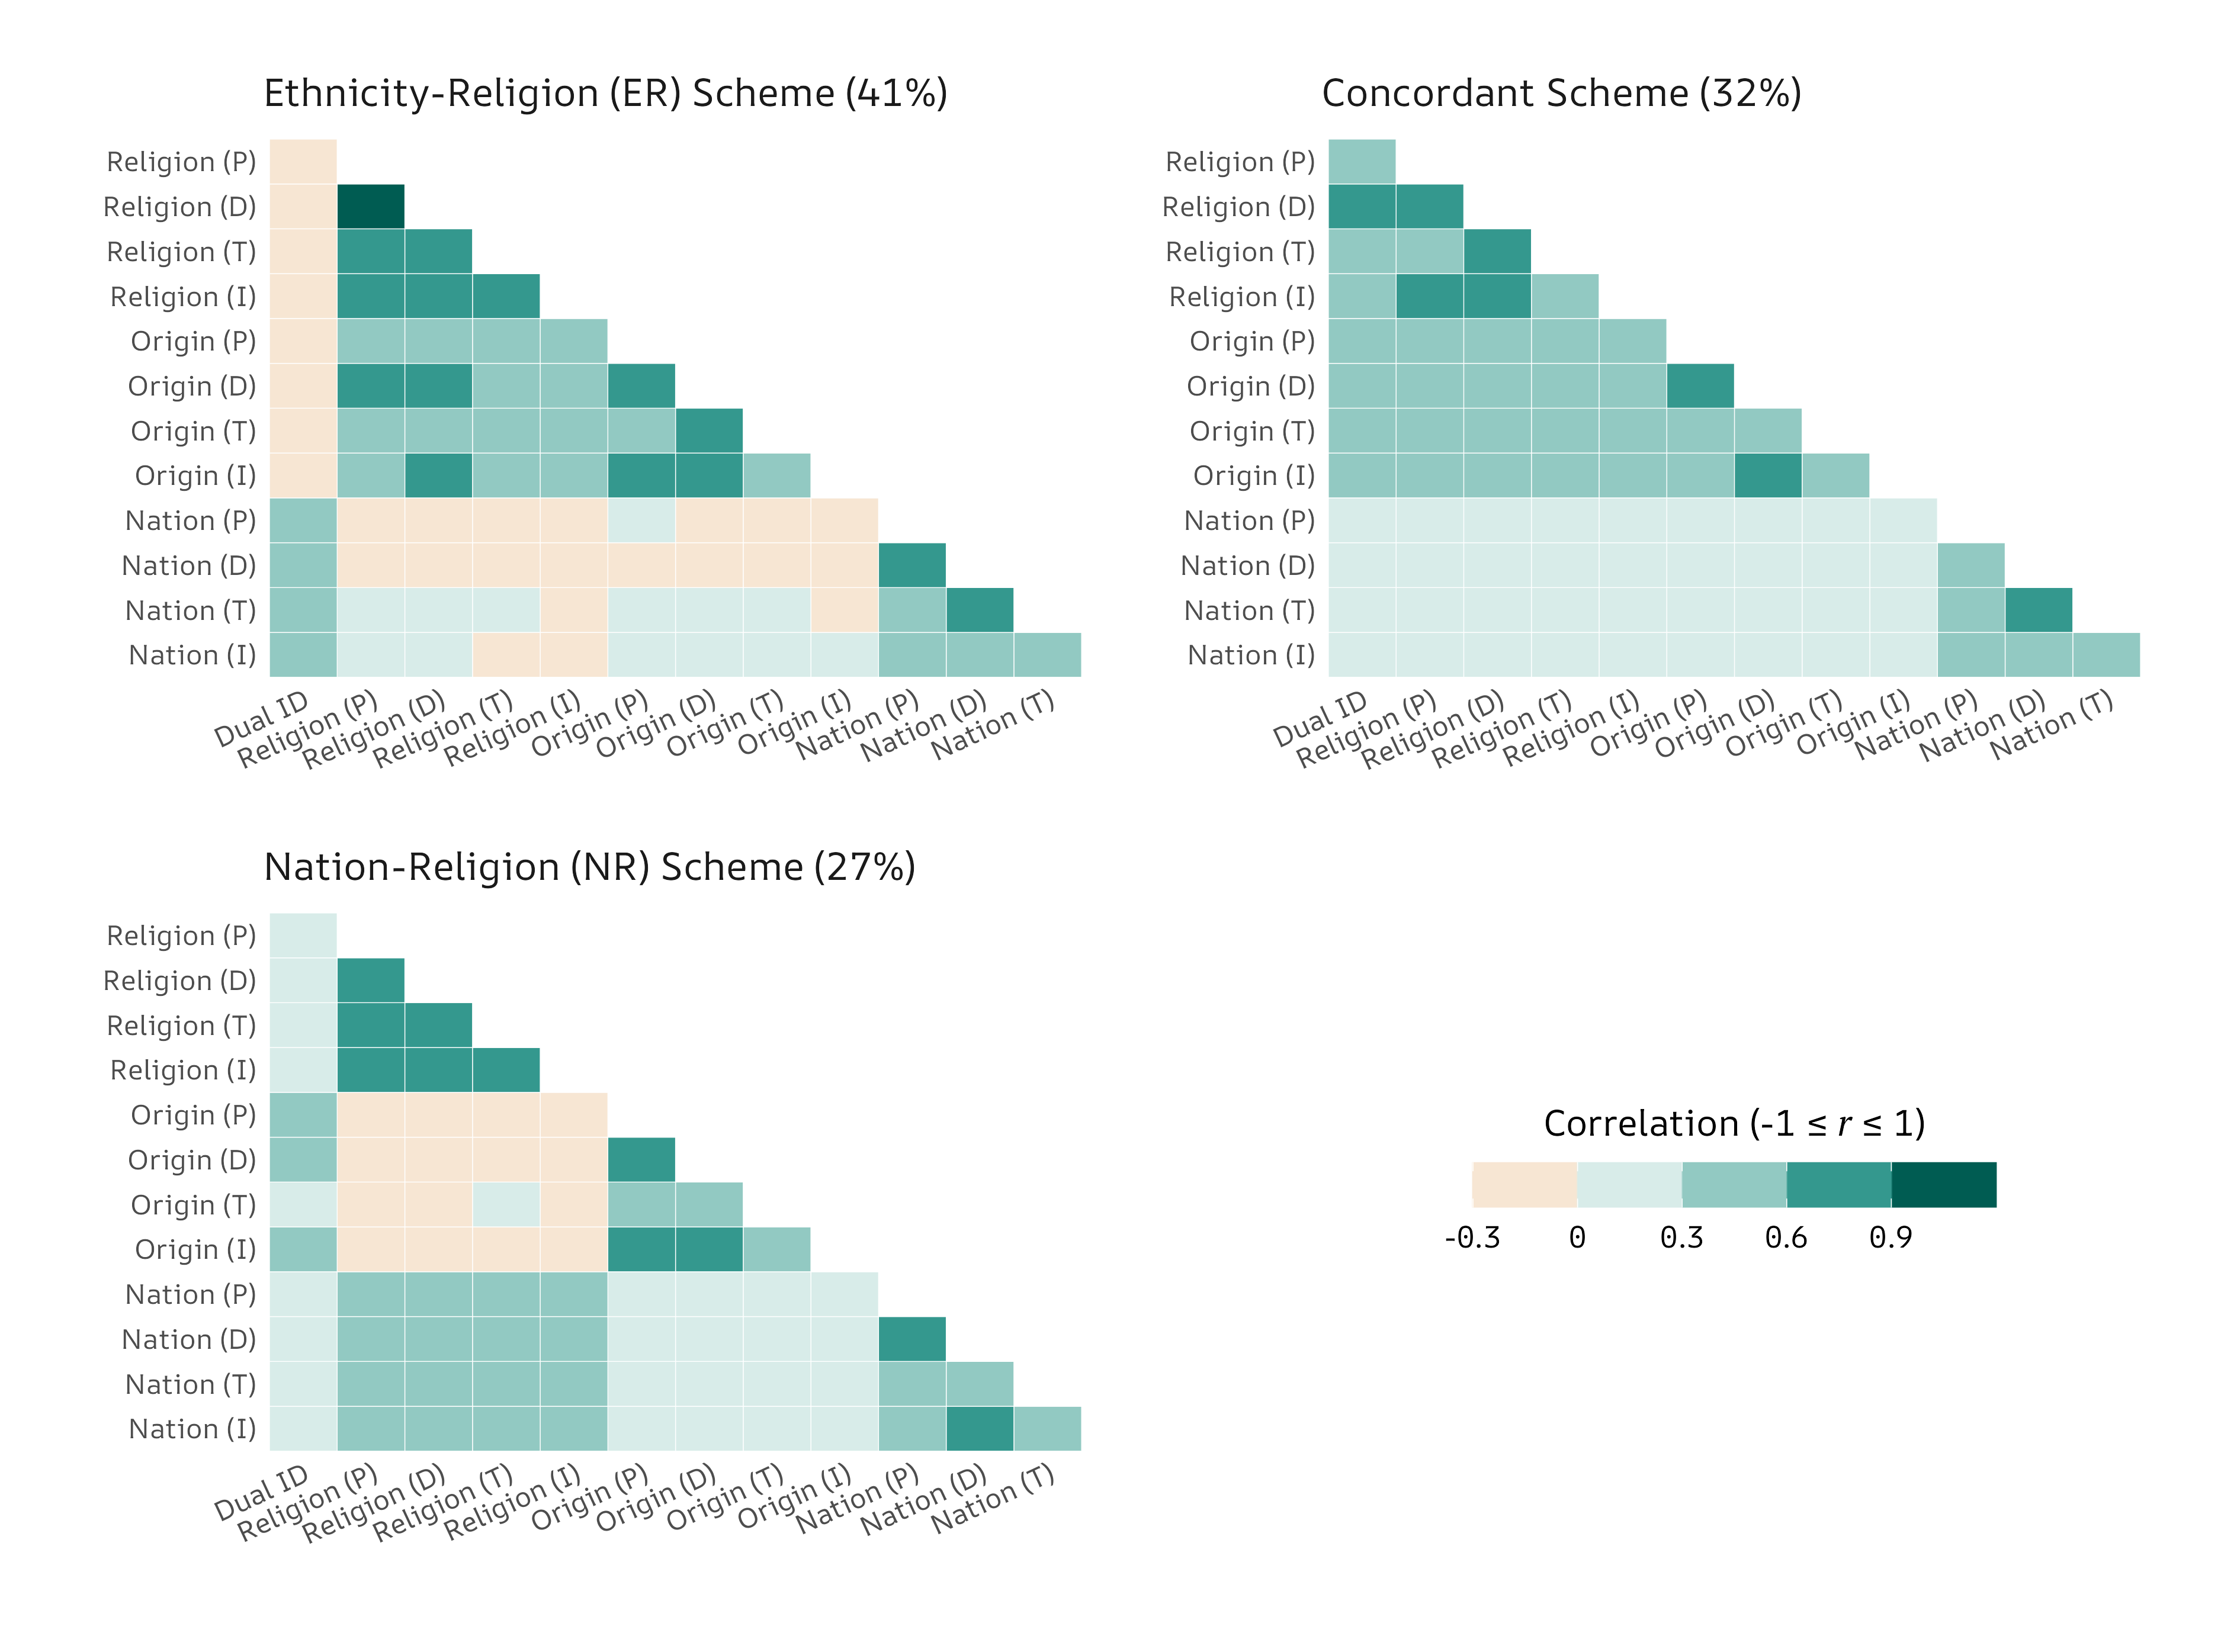
Figure 2
from Karim (2024).
Figure 3
from Karim (2024).
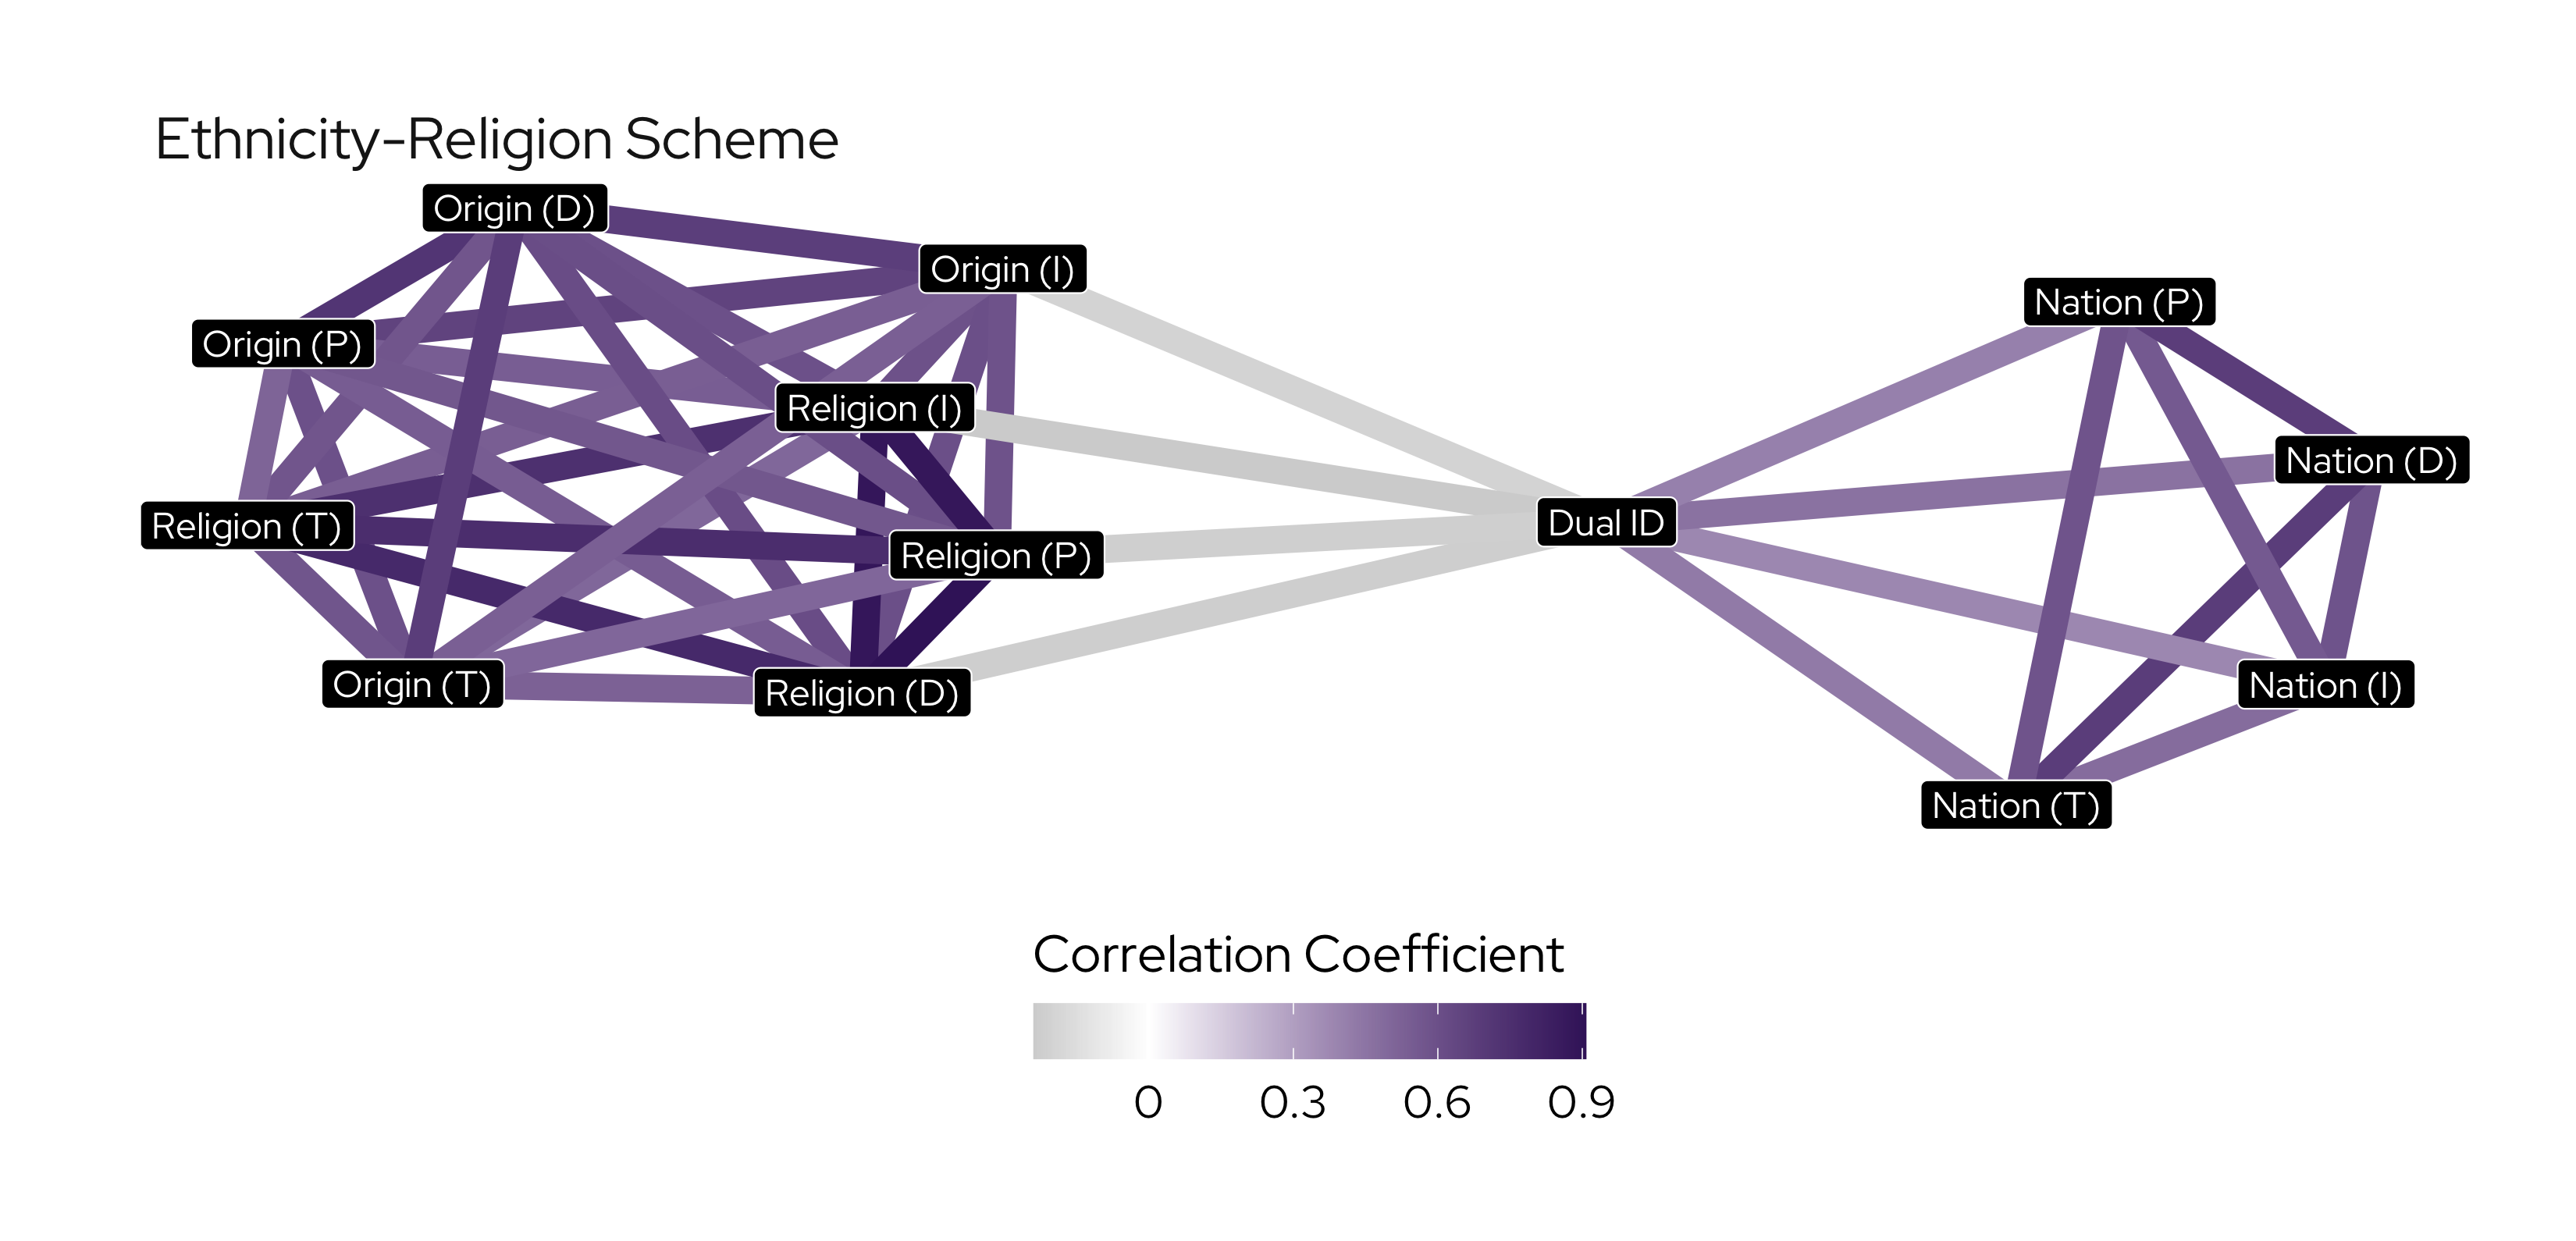
Adaptation of Figure 3
from Karim (2024).
In groups of 2-3, discuss (i) the causal assumptions underlying your research; and (ii) how you could, in principle, draw on relational techniques to measure x, your phenomenon of interest.
Note: Scroll to access the entire bibliography
Why might nicotine consumption and lung cancer be correlated?
Smoking is the confounder in this instance.
Why might ice cream sales and crime be correlated?
Season/temperature is the confounder in this instance.
Why might private school attendance and SAT scores be correlated?
Parental socioeconomic status is the confounder in this instance.
Why might shoe size and reading ability be correlated among children?
Age is the confounder in this instance.